IVRCL infra ready for an upmove
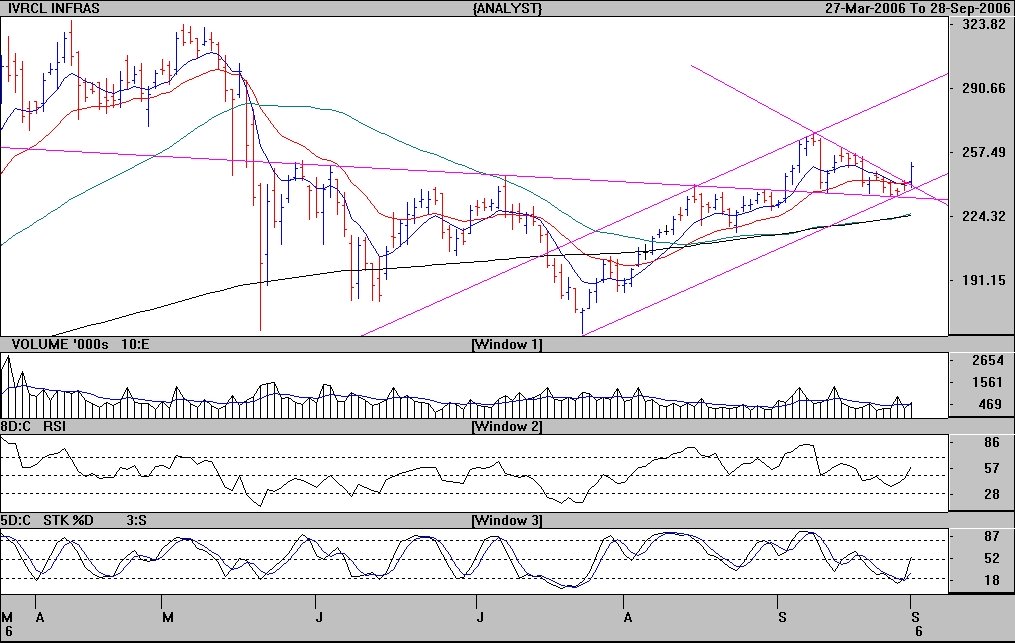
IVRCL infra. (CMP at 250) is breaking out of a good support area where trendlines and moving averages had converged. Following the up wards slopin channel a tgt of 290 is possible. Stop loss at 228 on closin basis is necessary
posted by Hemanshu Pandey @ 9/28/2006 07:16:00 PM
0 Comments
![]()
![]()

